
A credit card data-driven spending plan is a financial strategy that uses your actual transaction history to build a personalized, category-level budget for managing credit spending. Most Americans carry this need urgently: the U.S. personal saving rate dropped to 2.6% in april 2026, down from 5.8% just a year earlier, against a historical average of 8.4%. That gap between where savings sit and where they should be is exactly what a structured, data-backed credit card plan closes. This guide walks you through every step, from gathering your data to avoiding the traps that make most budgets fail within 60 days.
What is a credit card data-driven spending plan?
Spend categorization is the industry term for what most people call "tracking where the money goes." A credit card data-driven spending plan takes that concept further. It uses real transaction data, not estimates, to set category budgets, flag spending drift, and align your credit usage with actual savings goals.
Generic budgeting advice tells you to "spend less on dining." A data-driven plan tells you that you spent $487 on dining last month, that dining represents 18% of your discretionary budget, and that cutting it by $120 would move your savings rate from 2.6% to roughly 7%. That specificity is what makes the difference between a plan you follow and one you abandon.

The approach works for anyone carrying one or more credit cards. It does not require a finance degree. It requires your last 90 days of statements and about two hours of setup time.
What tools and data do you need to get started?
The right inputs make or break your plan before you write a single budget number.
Data you need to collect:
- Three months of credit card transaction history (CSV or PDF export from your card issuer's portal)
- Your monthly take-home income
- Fixed obligations: rent or mortgage, insurance premiums, minimum card payments, subscriptions
- Any debit or cash spending that represents a significant share of your monthly outflow
Tools that work well:
- Spreadsheet software (Google Sheets or Microsoft Excel) for sorting and summing by category
- AI assistants such as ChatGPT or Claude for generating budget recommendations from pasted data
- Finja, which automates transaction tracking and category alerts without manual data entry
One step most guides skip: before uploading any statement to an AI tool, redact your card numbers, full name, and account identifiers. Replace them with placeholders like "Card A" and "Cardholder." Beyond redacting, turn off AI model training in the data controls of whichever AI tool you use. This prevents your financial data from being used to train future models.
Pro Tip: Categorize spending into 8–12 broad buckets rather than analyzing every individual transaction. Broad categories like dining, groceries, travel, gas, and subscriptions reveal high-level trends without creating analysis paralysis.
How do you build your spending plan step by step?
This is the core workflow. Follow it once and you will have a repeatable system.
-
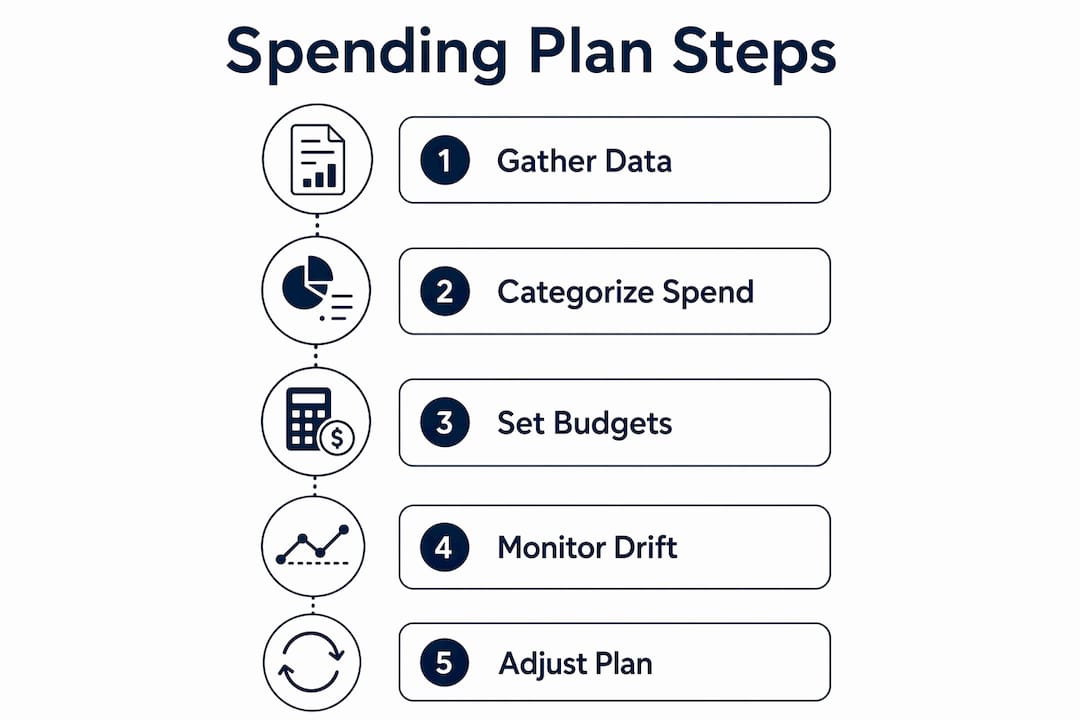
Pull your baseline. Export 90 days of transactions from each credit card. Combine them into one spreadsheet. Add a "Category" column and assign each transaction to one of your 8–12 categories. This baseline is your ground truth.
-
Calculate category totals. Sum each category across all three months. Divide by three to get a monthly average. You now know exactly where your money goes, not where you think it goes.
-
Set category budgets. Start with your take-home income. Subtract fixed obligations. The remaining amount is your discretionary pool. Allocate it across categories based on your averages, then apply cuts where the data shows room.
-
Set a realistic savings target. The U.S. average savings rate sits near 2.6%. Targeting 5–10 percentage points above your current rate produces better adherence than jumping straight to 20%. If you currently save nothing, aim for 7–9% first.
-
Use an AI prompt to stress-test your plan. Paste your category averages (with personal identifiers removed) into ChatGPT or Claude and ask: "Based on these spending averages and a take-home income of $X, suggest a monthly budget by category that achieves a 9% savings rate with realistic cuts." The output gives you a starting draft in minutes.
-
Pick one high-leverage habit to track each month. Monitoring every category simultaneously leads to burnout. Choose the single category with the largest gap between your average and your budget, and focus there first.
The table below shows how focusing on the three highest-impact categories compares to spreading effort across all categories.
| Approach | Categories tracked | Typical monthly savings gain | Sustainability |
|---|---|---|---|
| Big Three focus (dining, groceries, base spend) | 3 | High | Strong |
| Full category tracking | 8–12 | Moderate | Low to moderate |
| No category tracking | 0 | None | N/A |
Pro Tip: Optimizing dining, groceries, and base spending can add an average of $1,265 in annual card value on a $45,600 annual spend. Start with these three before touching any other category.
A credit card financial modeling guide can help you go deeper on projecting long-term savings impact from category-level changes.
How do you maintain your plan and avoid spending drift?
Spending drift is the slow, unnoticed growth in monthly expenses that erodes savings over time. It does not feel like overspending. It feels like normal life getting slightly more expensive each month.
The standard trigger for catching drift early: a 10% month-over-month increase in any single spending category. That threshold is specific enough to catch real problems without firing false alarms on every minor fluctuation.
Practical steps to stay on track:
- Review your category totals on the same day each month. Fifteen to twenty minutes is enough.
- Compare this month's cumulative spending curve to last month's, not just the final total. Tracking cumulative pace against the prior month's curve accounts for recurring bills and gives earlier warnings than flat monthly thresholds.
- Set alerts that trigger only when spending is off pace or approaching a budget limit. Actionable alerts reduce cognitive load far more than dashboards you have to remember to check.
- Increase your savings target by 1–2 percentage points every quarter, not all at once.
The wealth impact of unchecked drift compounds quickly. Monitoring 15 spending categories and applying a 7% investment opportunity cost shows that even modest monthly overruns translate into significant long-term wealth loss. Catching a $150 monthly dining drift early is not about the $150. It is about the $1,800 per year and the compounding growth that money could have generated.
For a broader view of keeping multiple cards under control, the multiple credit card management tips guide covers card-level strategies that complement category tracking.
What mistakes should you avoid with a data-driven spending plan?
Most plans fail for predictable reasons. Knowing them in advance saves you from restarting from scratch.
Common pitfalls:
- Over-categorizing. Creating 25 spending categories feels thorough. It produces a spreadsheet you stop opening after two weeks. Stick to 8–12 broad categories.
- Ignoring context behind spending spikes. A $600 dining month might mean a birthday celebration, not a habit problem. Review the transactions behind any spike before cutting the budget.
- Setting savings targets too high too fast. Jumping from 2.6% to 20% savings in one month almost always fails. Multi-month comparison of actual versus planned spending builds lasting behavior change better than aggressive one-time targets.
- Skipping the monthly review. A plan with no review is just a spreadsheet. A monthly review under 20 minutes is sustainable and sufficient to keep the plan working.
- Ignoring alerts. Alerts only help if you act on them. Set a rule: any alert triggers a five-minute check of that category's transactions before the week ends.
"The goal is not a perfect budget. The goal is a budget you actually use. Swap out any cut that feels impossible to keep for a smaller, manageable alternative. A $30 reduction you stick with beats a $150 cut you abandon after two weeks."
Pro Tip: When a budget cut feels unsustainable, replace it with a smaller version rather than removing it entirely. Cutting dining from $500 to $470 instead of $350 keeps the habit alive without triggering the psychological resistance that kills most plans.
Key Takeaways
A credit card data-driven spending plan works because it replaces guesswork with real transaction data, category-level budgets, and consistent monthly reviews that catch drift before it compounds.
| Point | Details |
|---|---|
| Start with 90 days of data | Use three months of actual transactions as your baseline before setting any budget number. |
| Use 8–12 broad categories | Broad buckets prevent analysis paralysis and reveal meaningful spending trends faster. |
| Target realistic savings gains | Aim 5–10 percentage points above your current savings rate, not an aspirational number you cannot sustain. |
| Track cumulative pace, not just totals | Compare this month's spending curve to last month's to catch drift early and accurately. |
| Review monthly in under 20 minutes | Consistent short reviews outperform exhaustive tracking that burns out within weeks. |
What I have learned from watching people build these plans
The most common mistake I see is treating a spending plan like a one-time project. People spend two hours building a beautiful spreadsheet, feel accomplished, and never open it again. The plan is not the spreadsheet. The plan is the monthly 20-minute habit of comparing what you spent to what you intended to spend.
The second trap is guilt. When the data shows you spent $800 on dining, the instinct is to slash it immediately. That rarely works. The better move is to understand why the number is what it is, then make one targeted adjustment. Data without context produces bad decisions.
I also think most people underestimate how much category focus matters. Trying to fix every spending category at once is like trying to lose weight by changing everything about your diet simultaneously. Pick dining, groceries, and your largest discretionary category. Get those three right. The rest tends to follow.
The debt-free credit card strategy guide covers the next logical step once your spending plan is stable: using that discipline to eliminate balances and stop paying interest entirely.
— Grace K.
How Finja fits into your spending plan
Building a data-driven credit card plan manually takes time. Finja automates the parts that most people skip: transaction categorization, spending pace tracking, and personalized alerts when a category runs over budget.
Finja is an AI-powered credit card management platform built for people managing one or more cards who want real visibility into their spending without hours of spreadsheet work. It tracks category-level spending automatically, sends alerts when you are off pace, and surfaces the specific decisions that reduce interest costs and improve credit health. Privacy is built in, with the same data protection principles this guide recommends for manual AI tools. If you are ready to move from a manual plan to an automated one, Finja's AI credit card coaching gives you the infrastructure to make it stick.
FAQ
What is credit card spend categorization?
Credit card spend categorization is the process of grouping transactions into broad categories like dining, groceries, and travel to identify spending patterns. Using 8–12 categories produces clearer trends than tracking every individual purchase.
How many months of data do I need to start?
Ninety days of transaction history gives you a reliable baseline. One month can reflect unusual spending, while three months smooths out one-time events and shows your actual habits.
What savings rate should I target first?
Set your initial target 5–10 percentage points above your current savings rate. With the U.S. average near 2.6%, a target of 7–9% is both meaningful and achievable without requiring drastic lifestyle changes.
How do I know if my spending is drifting?
A 10% month-over-month increase in any single category is the standard drift alert threshold. Comparing your cumulative spending curve to the prior month's curve catches drift earlier than waiting for the final monthly total.
Can I build this plan without AI tools?
Yes. A spreadsheet with category columns and monthly totals gives you everything you need. AI tools like ChatGPT or Claude speed up the budget recommendation step, but they are not required to run an effective plan.